macmon – Mac Usage Monitor in Terminal
When MacBook moved to ARM architecture (M1 processor), old system APIs stopped working and with them existing monitoring tools. However, macOS has a built-in console utility called powermetrics. It can show real-time resource consumption, but it does it in plain text.
asitop is the first utility that allows users to view resource and energy consumption visually in a terminal. But it works on top of powermetrics which requires sudo to work. The program is written in Python and has compatibility issues with new M-processors.
macmon attempts to solve these issues. Coded in Rust as a single binary file it uses an undocumented Apple API (the same API that uses powermetrics, but doesn’t require sudo) to get metrics on system utilization, power consumption and temperature.
Installation
brew install vladkens/tap/macmon
Features
- No Sudo Required: Run seamlessly without administrative privileges.
- Real-Time Metrics: Monitor CPU/GPU/ANE power usage live.
- Detailed Utilisation: Track CPU usage per cluster and RAM/Swap usage.
- Historical Data: View historical charts with average and max values.
- Customizable Interface: Switch between six color variants.
- Compact Design: Fits neatly in a small terminal window.
- Built with Rust: Ensuring performance and reliability.
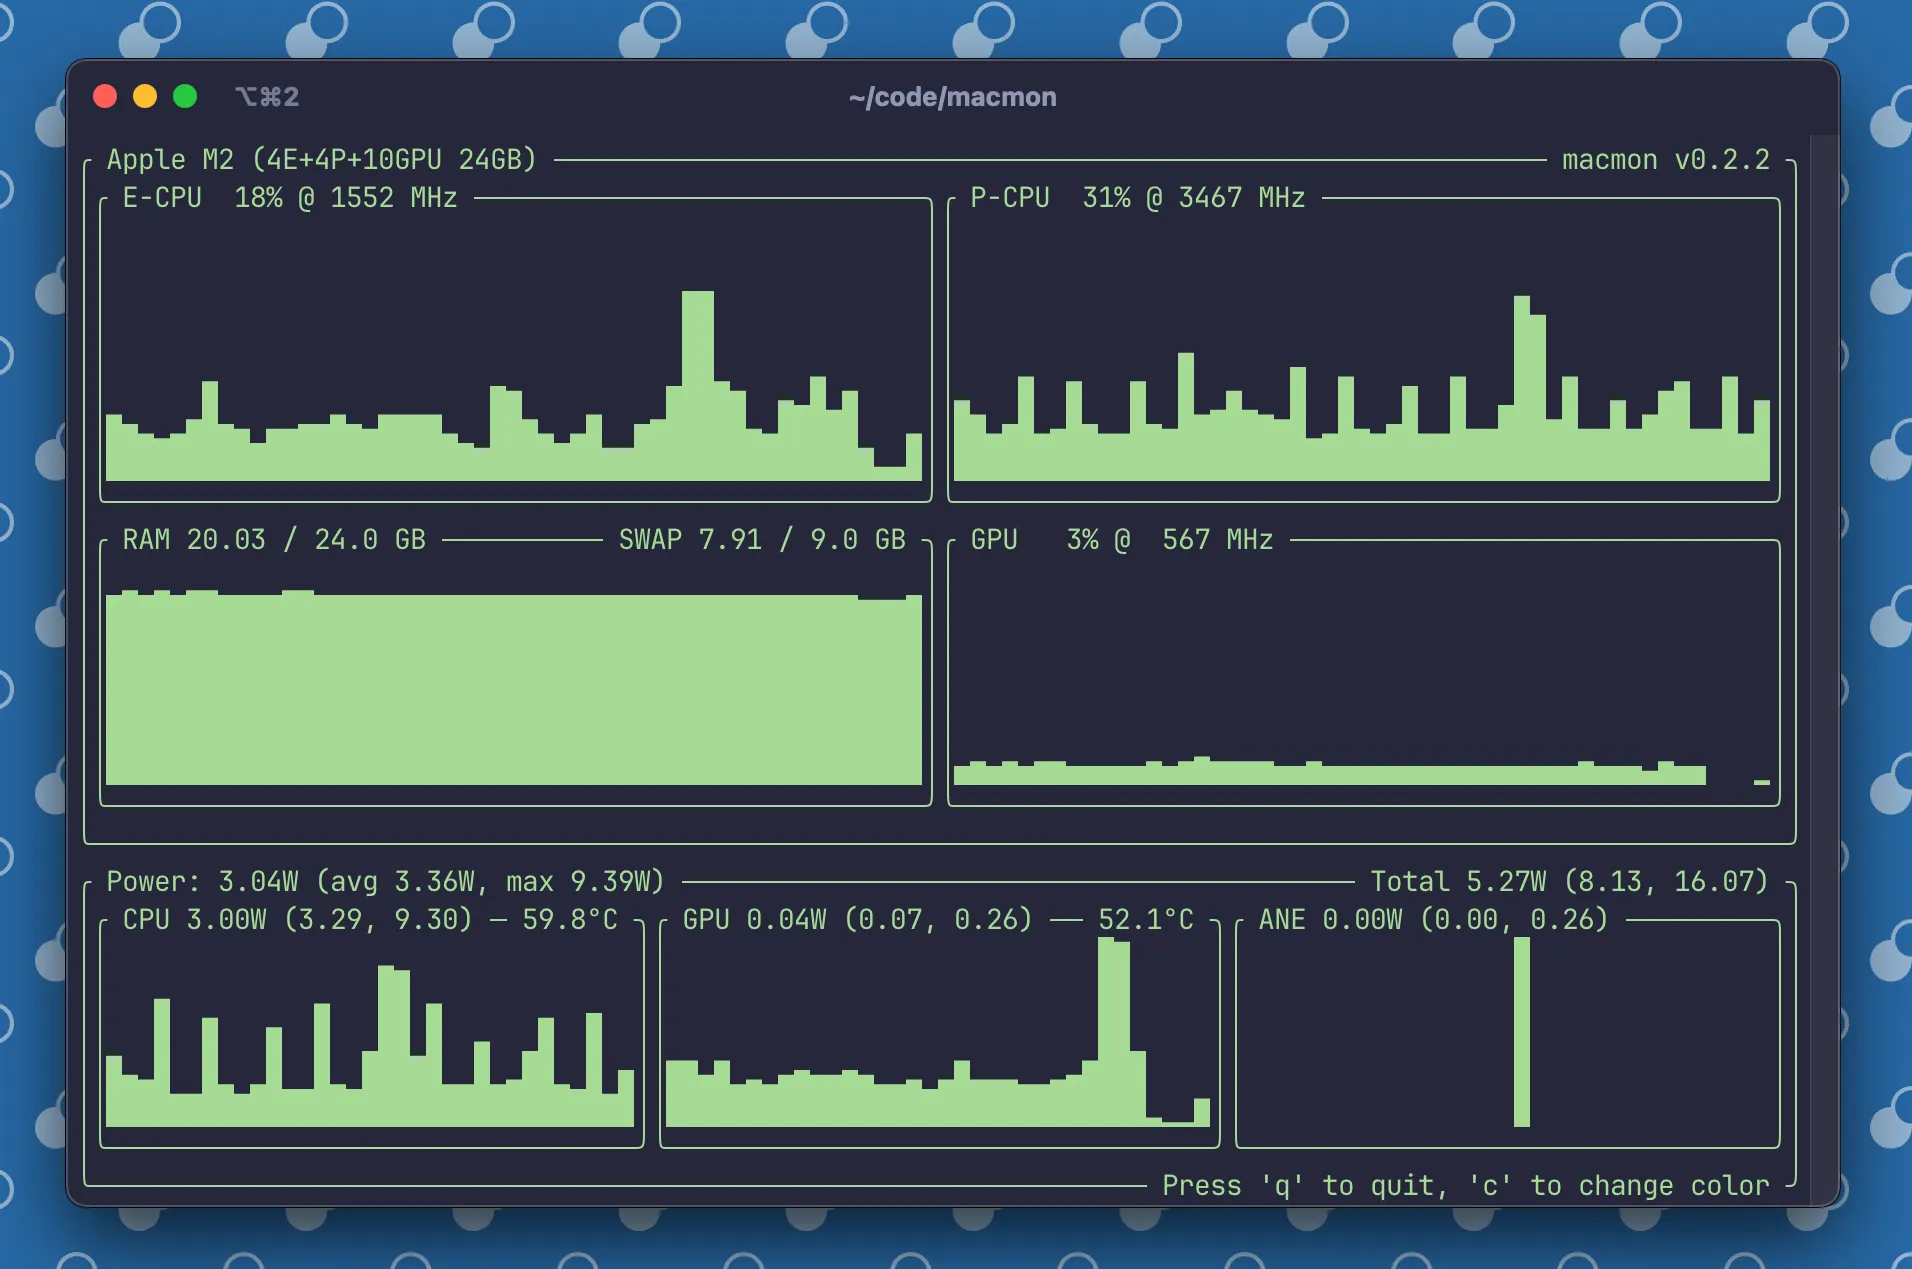
Interface Overview
The top line shows the chip model, number of Effective (E) and Performance (P) cores, number of GPU cores, and RAM.
The second line shows the chart of E and P cluster utilization of the CPU. MacOS uses E-cores for normal tasks, but when something complex needs to be done, process switches to P-cores.
The third line shows memory usage and GPU loading (during gaming, video processing or LLM running 😈).
And finally, the fourth line, the most interesting one, shows the power consumption for compute tasks, by system in general and separately for CPU, GPU and ANE (Apple Neural Engine). It also shows the average temperature of CPU and GPU.
macmon is an open-source program. You can view, star, request features or report bugs on Github.